The Problem
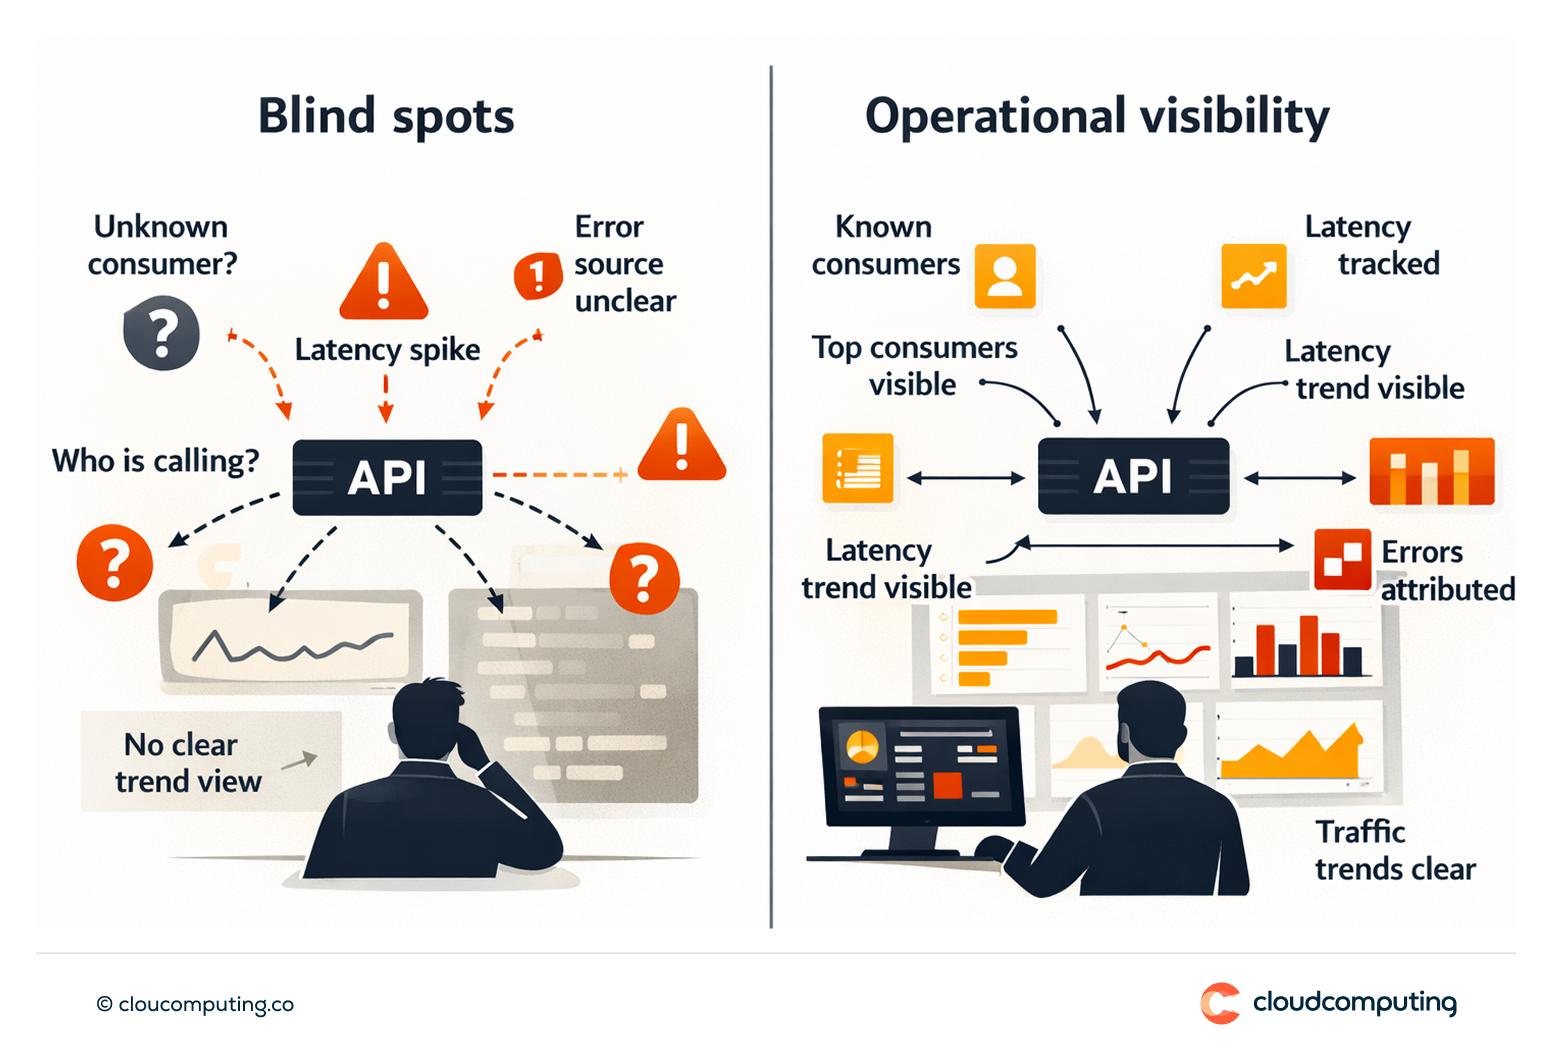
Root cause analysis is slow because visibility is limited.
Teams cannot reliably see who is calling what, why latency spikes occur, or which consumers are driving errors.
Without dashboards and tracing patterns, performance and capacity planning remain reactive.
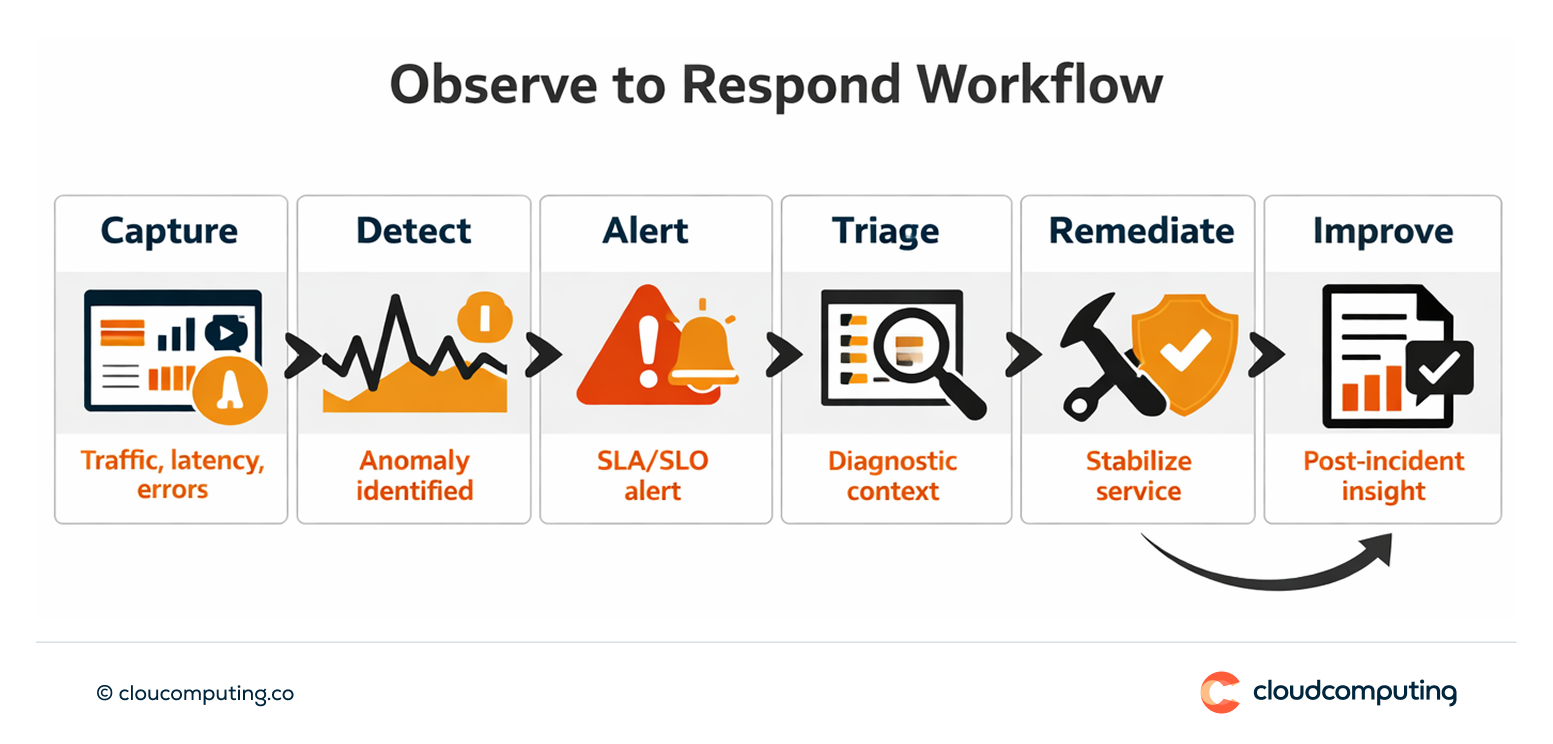
How we solve it: Implement API analytics dashboards, tracing patterns, SLA/SLO visibility, and operational alerting.
We implement observability for API programs so performance and incidents can be managed with facts.
- Analytics and dashboards
Track traffic, consumers, latency, errors, and policy outcomes. - Tracing patterns
Implement correlation and tracing patterns to connect gateway events to backend behaviour. - SLA/SLO reporting and alerting
Define thresholds and alerting workflows aligned to service objectives.
Expected outcome
- Faster incident response through clearer visibility and alerting
- Improved performance by identifying high-latency routes and bottlenecks
- Better capacity planning using usage and trend data
- Clearer accountability with consumer and owner visibility
Quick Answers
Why are API incidents hard to diagnose?
Because consumer visibility, latency attribution, and error context are often missing.
What should analytics show first?
Top consumers, latency distribution, error trends, and policy outcomes at the gateway.
How do SLAs/SLOs help?
They define service expectations and enable proactive alerting before major disruption.